We will describe some tips in using working electrode in following series of letter. It is not appropriate to distinguish which one is working electrode or counter electrode whenever we employ a system of two electrodes. In that case, it is just possible to discriminate them as anode or cathode. However, it is still unable to say exact values of potential of both anode and cathode, so that it remains uncertain whether purposed reaction is occurring or not. It is important to examine redox potential corresponding to intended reaction, for which the potential of working electrode should be measured.
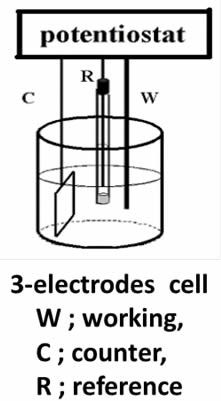
Distinct difference between working and counter electrode is applicable under using potentiostat. We can define the potential of a working electrode versus a reference electrode under so-called three electrode configuration (as shown in Figure below) by controlling with potentiostat. The understanding about potentiostat is desirable, even if not saying indispensable, which will be given later time.

Electrodes can be divided into two types: polarizable and non-polarizable electrodes.
The characteristic of an ideal polarizable electrode is that no faraday current flow when the electrode potential is varied. This type of electrodes usually can be used as Working or Counter electrodes.
The feature of a non-polarizable electrode is once the electrode potential be changed, the Faraday current flows out. In generally, this type of electrodes can be used as Reference electrodes.
An ideal polarizable electrode can be represented by a capacitor (condenser) in equivalent circuit as shown in Fig. 1-1. However, the extremely weak current flows at an actual polarizable electrode indeed. Therefore a high value resistance (Rhi) is required to parallel with the capacitor to represent the actual polarizable electrode in equivalent circuit [Fig. 1-(2)].
If a redox species coexists with the polarizable electrode, the redox reaction of species is occurred on the electrode surface and the Faraday current flows under the certain potential. In this case, a potential depending variable resistance (RF) should be added to the equivalent circuit in parallel. Furthermore, the effect of the species diffusion should be included, and a Warburg Impedance element is connected to Faraday resistance (RF) in equivalent circuit [Fig. 1-(3)].
Figure 1 is a schematic view of above description. In the absence of a redox system, even electrode potential has been changed, the capacitance and high resistance parallel circuit could still be maintained, this variable potential range is so called as potential window.
The wide potential window of the polarized electrodes is a very important condition in practical application. Platinum, Gold and Carbon (e.g., glassy carbon etc.) electrodes can meet this condition in general.


• Pyrolytic graphite (PG) is prepared by decomposing the hydrocarbon gas at the high temperature substrate. Pyrolytic graphite further dealt with high temperature and high pressure could be enhanced in the crystalline ordering, and highly oriented pyrolytic graphite (HOPG) can be obtained. The electrode performance is depended on the crystalline orderly ratio State of electrode surface can be detected by redox peak potential difference (ΔEp) in cyclic voltammetry (CV) diagram of ferrocyanide/ferricyanide. If the redox peak potential difference is higher than 700 mV (1M KCl supporting electrolyte solution, potential scan rate 0.2V/s), this surface is regarded as the basal plane of the highly oriented pyrolytic graphite (HOPG) (the peak potential difference of commonly used graphite electrode is around 60 mV). It is known that faster the electron transfer is, smaller the peak potential difference (ΔEp) will be, because the electron transfer rate on basal plane of the highly oriented pyrolytic graphite (HOPG) surface is very slow, that is why the large ΔEp value is appeared.
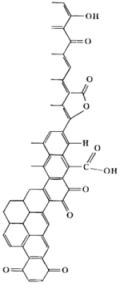
• Glassy carbon (GC) is the most commonly used electrode material, the structure of glassy carbon is shown in Fig. 4-1 (the left lower schematics). A lot of graphite structure shaped thin strip intertwine with each other in glassy carbon, although the microscopic structure has orderly morphology, but the macro structure can be regarded as amorphous (glassy) carbon. Therefore, as the electrode materials, allotropes of carbon are sp2 carbon in graphite structure (excluding diamond electrode). The surface of glassy carbon electrode (GC) is the mixture of basal plane and edge plane. Glassy carbon (GC) is dense and hard as glass, without gas or liquid permeability. In contrast, highly oriented pyrolytic graphite (HOPG) has a slippery flexible structure along the edge plane, peeling along the basal plane, a fresh surface can be obtained.
• Carbon paste is obtained by dispersed graphite powder in oil to paste state , can be used as an electrode (carbon paste electrode).
• Carbon fiber used for electrode preparation is called carbon fiber electrode. Usually, carbon fiber is used for microelectrodes preparation. Embedding the carbon fiber into the plastic or glass, after cutting, a cross-section is used as a microelectrode. Including glassy carbon, the basic structure is sp2 carbon bond.
• Positive holes in valence band are produced and conductivity is generated when boron element is mixed into sp3 bonded diamond (so called as boron-doped diamond electrode. If nitrogen element is incorporated, electronic conductivity is occurred.). A boron-doped electrode especially has very wide potential window. It has chemical stability like diamond, and can be used for special applications.


Fig. 5-2 Voltammograms of Fe(CN)6-3/-4 (1 M KCI) on three HOPG basal plane surfaces with different defect density. Solid lines are experimental in all cases. (A) Dashed line, simulated for k0obs = 6.1 x 10⁻⁵cm/s, a0 = 0.51, dα/dE = 0.30 V-1; dotted line, simulated for k0obs = 1.2 x 10⁻⁵ cm/s, α = 0.51, dα/dE = 0.0. (B) Dashed line, simulated for k0obs = 1.4 x 10⁻³ cm s-1, α0 = 0.50, dα/dE = 0.30 V-1. (C) Dashed line simulated for k0obs = 0.018 cm s-1, α0 = 0.50, dα/dE = 0.30. Simulation for dα/dE = 0.0 is identical to dashed line. Scan rate = 1.0 V/s in all cases. Potentials are vs Ag/AgCl.
The solid line is the measured CV curve and the dashed line is the simulated curve (introduction omitted here). Decreasing the constant of electron transfer rate, and adding the potential dependence of the transfer coefficient during simulation processing, it is shown that actual measurement can be reproduced by simulation. A reversible CV curve was obtained when lower basal orderliness C was used. The lower the orderliness of the base plane, the faster the electron transfer rate.
References:
5-1) McCreery et al., Anal. Chem., 64, 2518 (1992).
5-2) McCreery, Chem. Rev., 108, 2646 (2008).
5-3) McCreery et al., J. Phy. Chem., 96, 3124 (1992).


References:
6-1) Electroanalytical Chemistry, 17, 221—374 , (1991).
6-2) R.L.McCreery, Chem. Rev., 108, 2646, (2008).
6-3) P.Chen, M.A.Fryling and R.L.McCreery, Anal. Chem., 67, 3115, (1995).


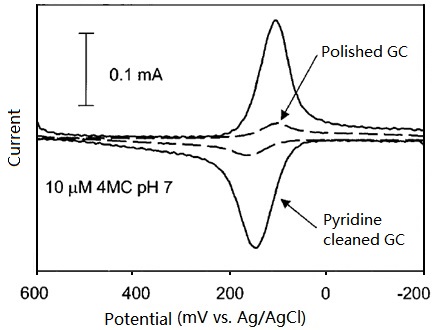
The electrochemistry regarding Quinone-hydroquinone including Catechol has been continuously studied for many years and it is an important theme spanning various related fields. Recently there is also an interesting report by D. H. Evans et al.8-3). Perhaps that story might touch either, relating to carbon electrode surface treatment, this time the introduction subject is also selected from literatures of McCreery et al. (8-1 - 8-2).


